MASL Capstone
Figures & Tables

Figure 1. Interview questions grouped by dimension with relevant ideas and themes.

Figure 2. Classification of Social Media Posts

Figure 3. Percentage of Type of Posts Made from August 1, 2019-September 20, 2019.
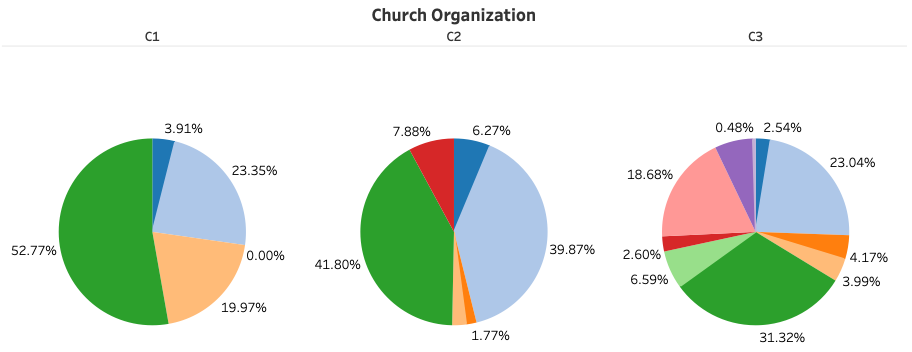
Figure 4. Percentage of Likes per Type of Post
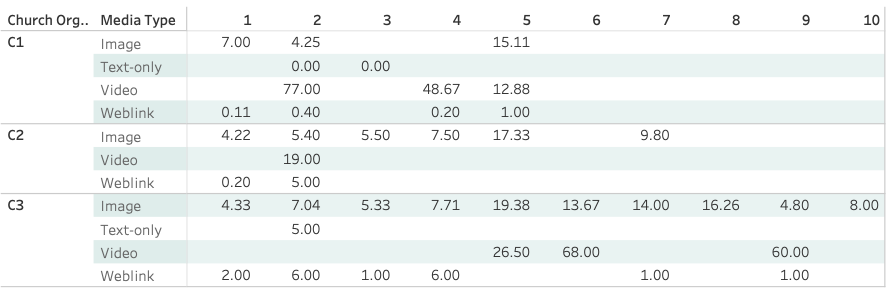
Table 1. Average Likes Per Media Type Compared with Type of Post (numbers 1-10).

Table 2. In-person Observations for each church plant. The Likert scale used from 1-10.

Figure 5. Leverage to Cohesion in Faith Communities using Senge’s (1990) principles.